10 Brand Strategy Metrics CMOs Should Track
Matt Bowen • March 21, 2025

10 Brand Strategy Metrics CMOs Should Track

Tracking the right metrics can make or break your brand strategy. Companies using six or more metrics grow 2.3x faster than competitors. Here’s a summary of the 10 most important metrics CMOs should focus on:


  1. Brand Health : Monitor your target market’s awareness (unaided and aided), familiarity, consideration, and first choice metrics for your brand. 
  2. Share of Voice (SOV) : Measure your visibility across social, search, paid, and earned media. Benchmark against competitors.
  3. Net Promoter Score (NPS) : Gauge customer loyalty. Scores above 30 are strong; 70+ is exceptional.
  4. Customer Acquisition Cost (CAC) : Track how much it costs to gain new customers. Keep a healthy CLV:CAC ratio of 3:1.
  5. Customer Lifetime Value (CLV) : Calculate the total revenue a customer brings over time. Focus on increasing retention and upselling.
  6. Website Conversion Rates : Optimize your site to turn visitors into customers. Industry benchmarks range from 2% (B2B) to 11% (media).
  7. Social Media Performance : Track engagement rates, sentiment, and how social drives traffic to your site.
  8. Marketing ROI : Measure the return on your marketing investments. Aim for 250-400% ROI depending on your industry.
  9. Lead Conversion Success : Analyze how well you convert leads into paying customers. Focus on visitor-to-lead and lead-to-close rates.
  10. Brand Value: Assess your market share, price premium, and customer retention to understand long-term brand equity.


Quick Overview of Metrics

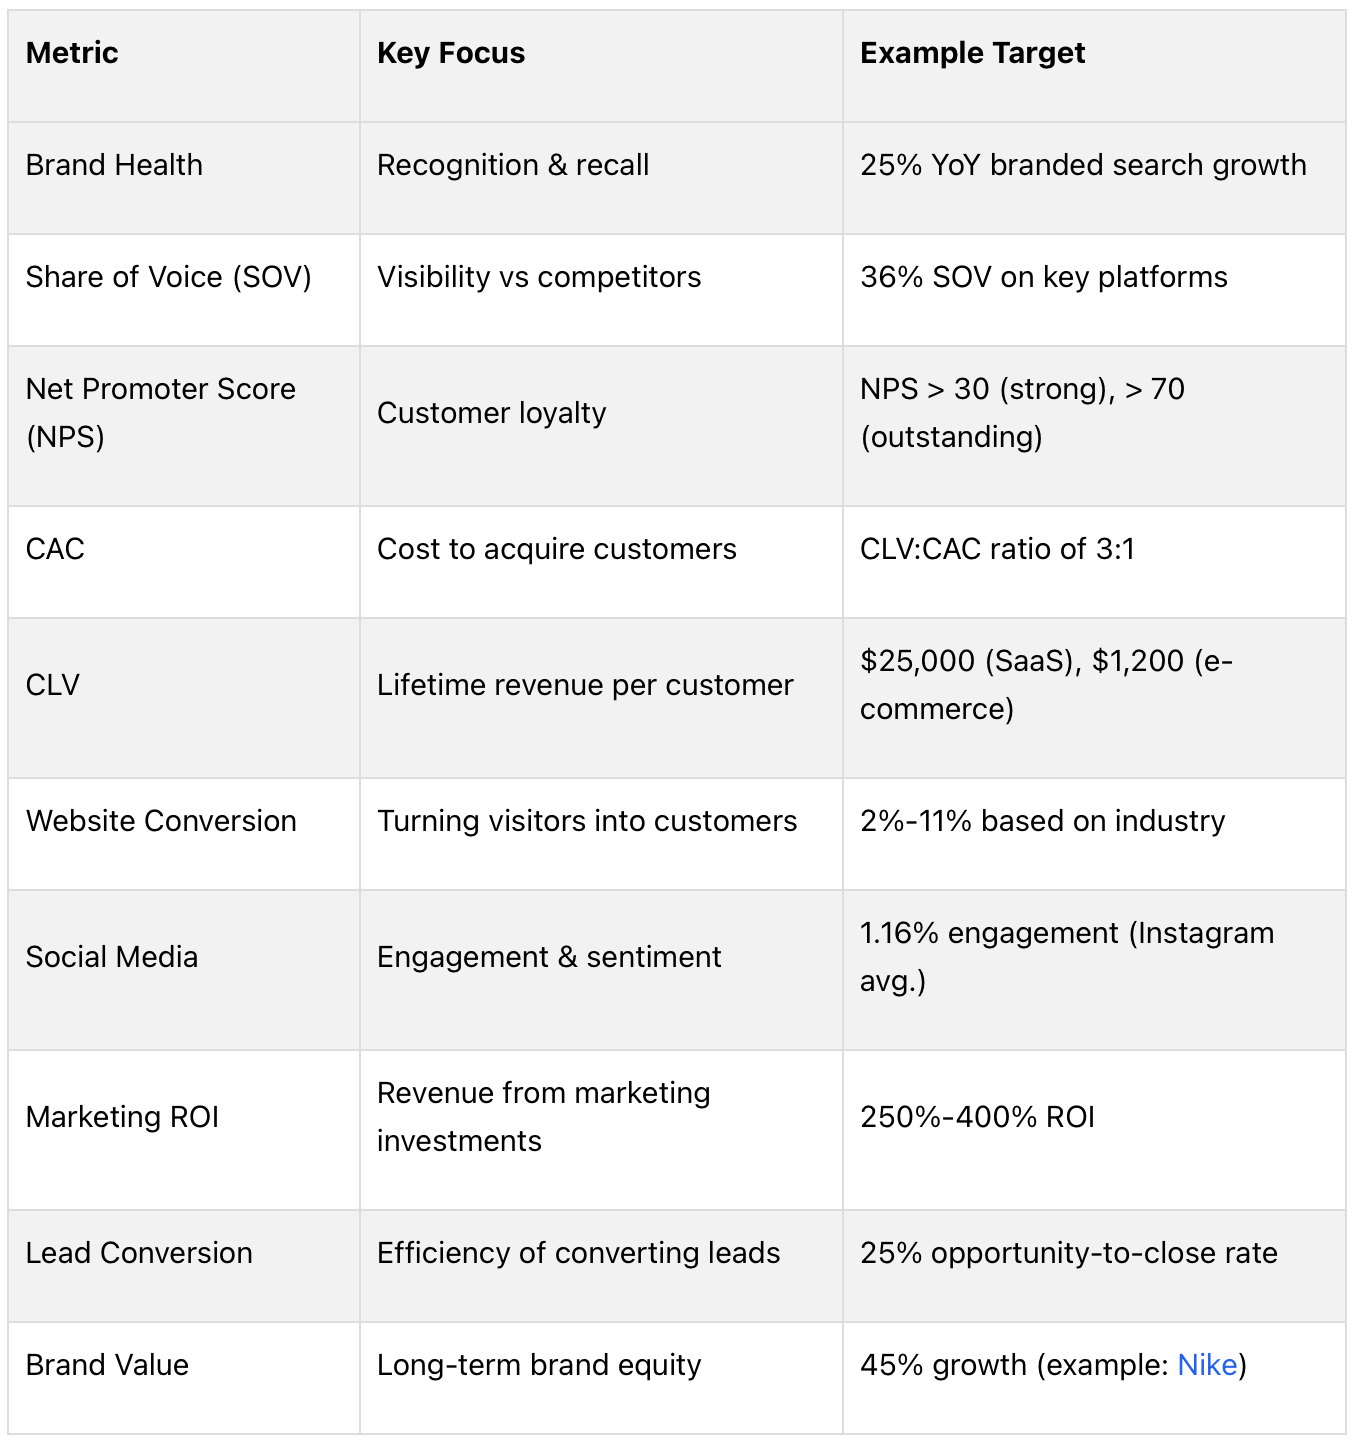
These metrics work together to track brand health, improve decision-making, and link marketing efforts directly to business growth. Start by prioritizing metrics that align with your current business phase - whether it’s building awareness, driving conversions, or maximizing lifetime value.


What are the most important branding KPIs


1. Brand Health Measurement

Brand health uses consumer insights to give a complete picture of your target’s awareness for you brand. As the starting point for evaluating performance, brand awareness focuses on two key aspects: aided (how well your brand is visually identified) and unaided (how easily people remember your brand without prompts).

Here are the three main areas to track:

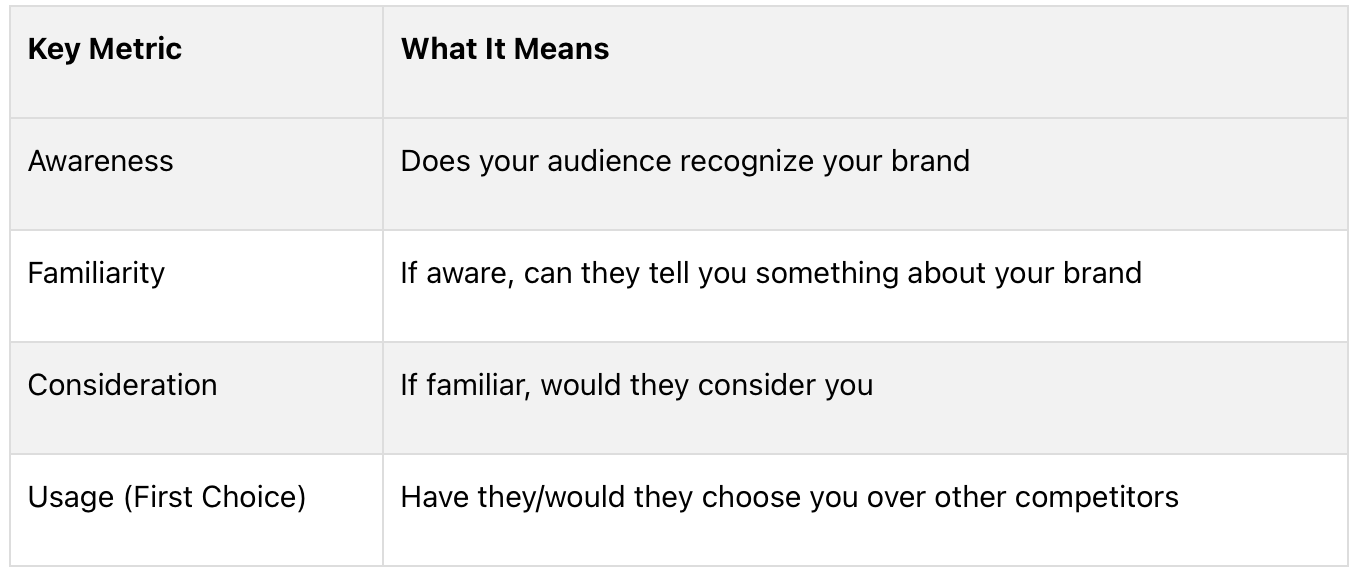
Brands that excel in awareness use a mix of these methods. For instance, Coca-Cola achieves a 94% aided recognition rate but only 65% unaided recall in the beverage market [5][7]. This highlights the importance of tracking both recognition and recall.


To put this into action, CMOs can focus on:

  • Analyzing the digital footprint with tools like Semrush
  • Conducting quarterly surveys
  • Monitoring branded search growth, aiming for a 25%+ year-over-year increase [3]


For benchmarks, B2C brands should aim for 10,000+ monthly social mentions, while B2B brands typically target around 2,000+. Recognition goals also differ: B2C brands often target 15-25% unaided recall, while B2B brands aim for 8-12%.


Understanding these metrics sets the stage for the next key performance indicator: Share of Voice Analysis, which measures how visible your brand is compared to competitors.


2. Share of Voice Analysis

Share of Voice (SOV) measures how much visibility your brand has across various channels, helping you decide where to focus resources and how to position against competitors. Using insights from brand awareness tracking, modern SOV analysis focuses on four main channels:

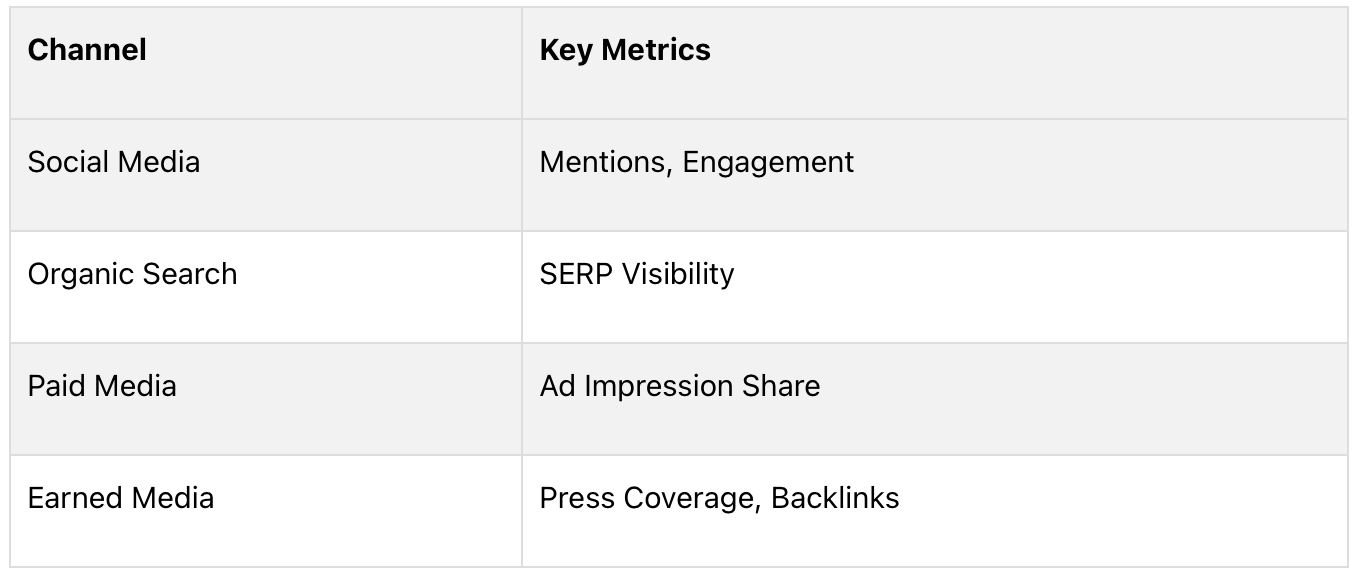
Take the fast-food industry as an example: In 2024, McDonald's held a 36% SOV on Twitter, outpacing Wendy's (19%) and Burger King (15%) [1]. This level of visibility shaped their market position and boosted customer engagement.

To track SOV effectively, CMOs should focus on these key areas:


Cross-Channel Monitoring
Keeping tabs on social media and news platforms in real time allows not only for tracking mentions but also for analyzing their tone. This ensures you understand both the quantity and quality of your brand's visibility 
[1][3].


Competitive Benchmarking
Context is everything. A 10% SOV might be a win in a niche B2B market but could signal underperformance in broader consumer sectors 
[8]. Regularly comparing your performance to competitors helps define realistic goals for your industry.


Strategic Response
If your SOV changes, acting fast is critical. For instance, a beverage company successfully regained visibility by shifting 20% of its budget to TikTok creators, achieving a 20% share within three months 
[3]. This shows how reallocating resources can align with business goals and quickly address gaps.


To get the most out of SOV tracking, combine it with sentiment analysis. High visibility doesn’t always mean positive results. Real-time data lets you adapt your strategy quickly when market conditions change [1][3].

This visibility also influences customer perceptions, often reflected in metrics like Net Promoter Score (NPS).


Net Promoter Score Tracking

Net Promoter Score (NPS) is a simple yet powerful way for CMOs to gauge customer loyalty and predict how well a brand might grow. Building on insights from Share of Voice analysis, NPS helps turn visibility into measurable customer advocacy.

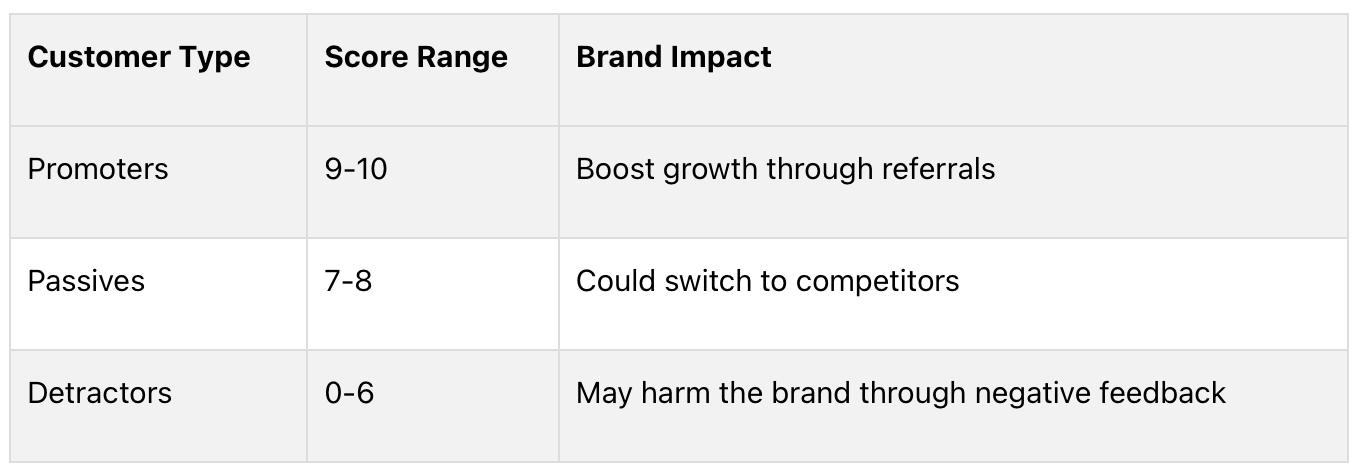
The formula is easy: subtract the percentage of Detractors from Promoters. For example, if 50% of customers are Promoters and 20% are Detractors, the NPS is 30 [1]. While industry benchmarks vary, a score above 30 reflects strong brand health, and anything over 70 is considered outstanding [1][2].


Practical Examples
Apple's NPS of 72 (2023) 
[2] and Slack’s 25% reduction in churn [2][4] highlight how leveraging NPS can lead to real business gains.


Key Ways to Track NPS:

  • Post-purchase surveys: Placed in transaction confirmations to get instant feedback.
  • Quarterly campaigns: Use survey platforms to track trends over time.
  • Social listening tools: Capture unprompted customer sentiment online [1][5].


Tying NPS to Business Growth
Brands with high NPS grow twice as fast as their competitors 
[2]. Plus, Promoters tend to spend 20% more annually compared to Detractors [2].

How to Act on NPS
To get the most out of NPS, focus on:

  • Resolving Detractor complaints within 48 hours.
  • Engaging Passives with targeted campaigns [1][4].


Improving loyalty not only drives higher spending but also reduces Customer Acquisition Costs, boosting overall efficiency.


4. Customer Acquisition Costs

NPS measures loyalty's role in growth, but CAC tells you how much that growth costs. As your brand gains traction, CAC should drop due to more organic customer acquisition - making it a critical metric for evaluating your marketing strategy. To calculate CAC, divide your total marketing spend by the number of new customers gained.

Lower CAC improves financial efficiency, freeing up resources to make your brand stand out.


Hidden Costs to Watch For

Don’t overlook hidden expenses like martech tools, sales team compensation, and content creation costs [2][4].


Tools to Improve CAC

Leverage tools like Google Analytics 4 for attribution tracking, CRM platforms to trace lead sources, and Rockerboxfor multi-touch tracking [1][3][4].
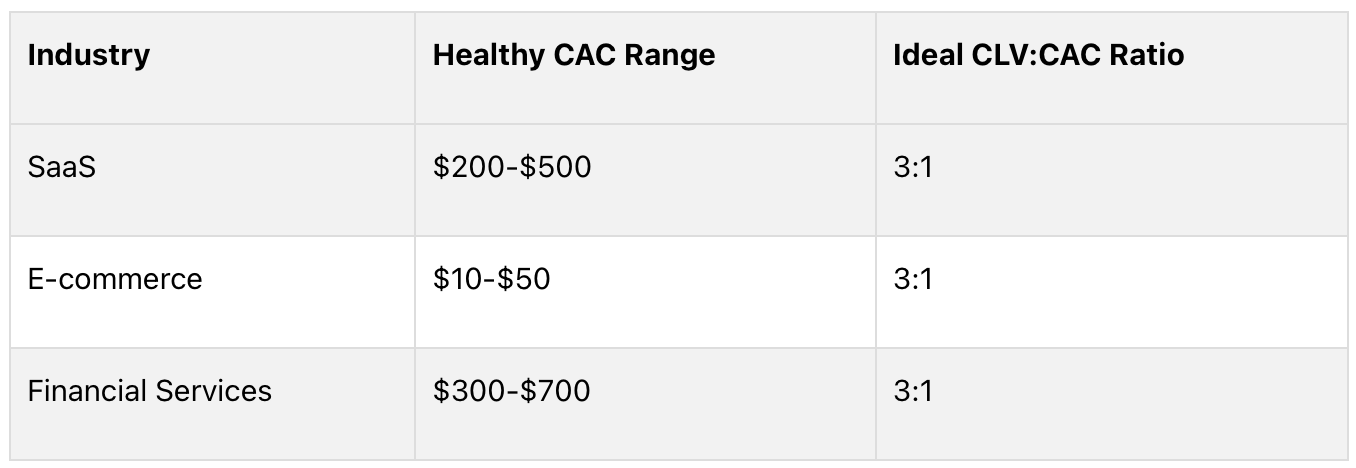

Industry Standards

Across industries, a healthy rule of thumb is that your customer's lifetime value (CLV) should be at least three times your CAC [2][4].


The Role of Privacy and AI

Privacy regulations are reshaping how we measure CAC. Consider "Influence CAC", which tracks how brand-building efforts lower acquisition costs over time [2][4]. This ties directly to the broader discussion of linking brand health to financial performance.


5. Customer Lifetime Value

Customer Lifetime Value (CLV) helps you understand the total revenue a customer can bring over their relationship with your business. While CAC (Customer Acquisition Cost) focuses on what it takes to acquire a customer, CLV highlights the long-term payoff of that investment.


How to Calculate CLV

To calculate CLV accurately, you’ll need three key metrics:

  • Average purchase value
  • Purchase frequency
  • Customer lifespan


For example, if a customer spends $100 per transaction, makes four purchases a year, and stays with your business for five years, their CLV would be $2,000 [2][3].
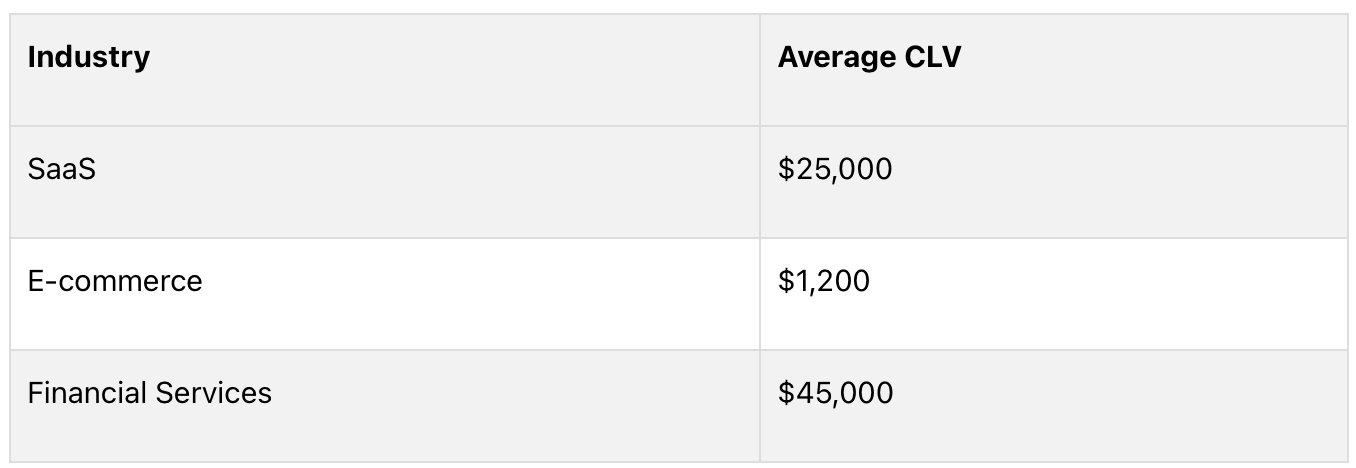

Industry Averages

Here’s how CLV looks across different industries:

Tools for Better CLV Tracking

Modern tools like Salesforce Einstein Analytics take CLV tracking to the next level. By integrating social sentiment data, businesses like L'Oréal have improved their CLV predictions by 37% using AI-driven models [3][4][6].


Real-World Example: Starbucks Rewards

Starbucks uses its rewards program to boost CLV. Members visit six times a month on average, compared to just two visits for non-members. This app-based tracking significantly increases customer spending [3][5].


The Role of Data Quality

Poor data is a challenge for many - 42% of marketers struggle with incomplete customer journey insights [4][6]. Unified Customer Data Platforms (CDPs) can solve this by:

  • Tracking customer interactions across channels
  • Measuring purchase habits
  • Analyzing overall customer behavior


Understanding CLV helps businesses focus on their most valuable customers, guiding strategies to build stronger, long-term relationships. It also ties directly to website conversion rates, showing how well you’re turning visitors into loyal buyers.


6. Website Conversion Rates

Website conversion rates show how well your digital presence turns visitors into customers or leads. While CLV (Customer Lifetime Value) focuses on long-term gains, conversion rates highlight immediate success in engaging your audience.
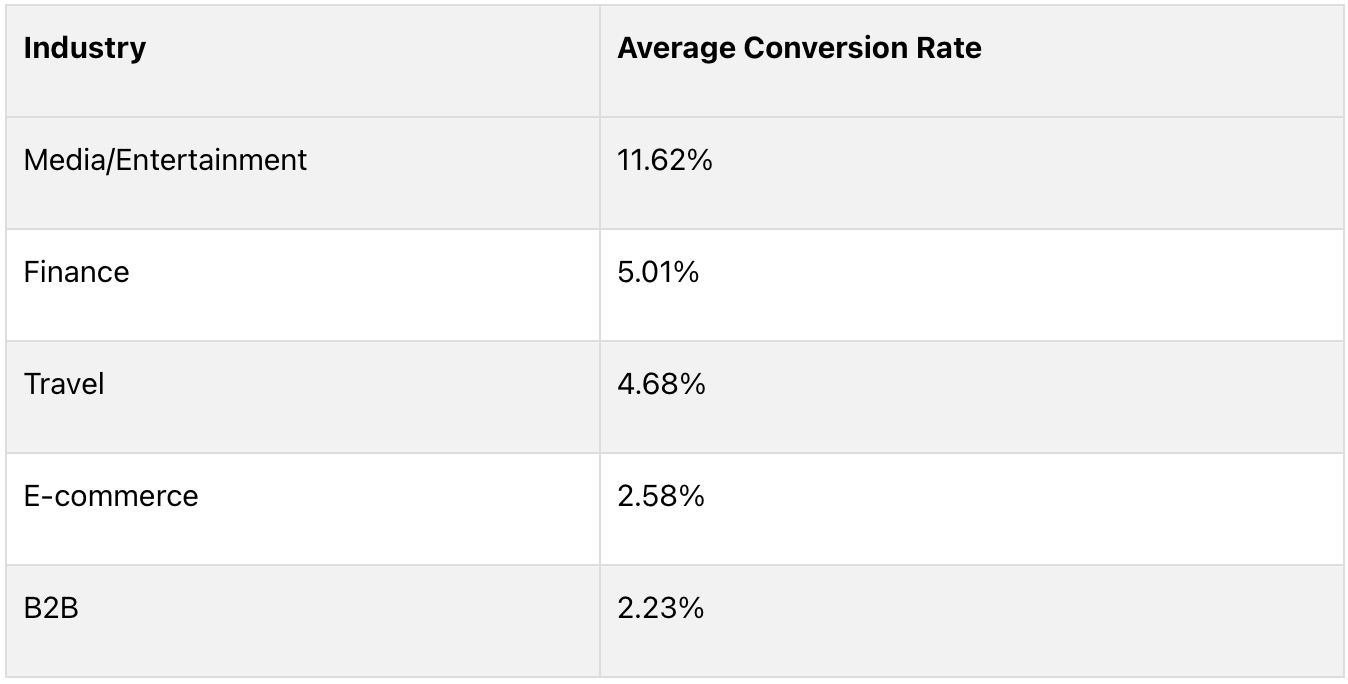

Industry Benchmarks

Different industries have varying conversion averages. Knowing these benchmarks helps set realistic goals:

Mobile vs Desktop Performance

Mobile users convert 40% less often than desktop users [1]. This gap highlights challenges with mobile optimization and the risk of damaging brand trust. Slow-loading mobile sites, for instance, can make even premium brands seem unreliable.


Key Performance Indicators

Micro-conversions, like newsletter signups or account creations, reveal where users encounter obstacles in their journey. Tracking these smaller actions helps identify problem areas and improve the overall experience.


Speed's Impact on Conversions

Website speed plays a major role in both conversions and how users perceive your brand. Research shows that a 1-second delay in load time can cut conversions by 7%. Even worse, 79% of users will abandon a site if it takes longer than 3 seconds to load [3].


AI-Driven Improvements

AI tools are becoming a game-changer for conversions. For example, Walmart increased its conversion rate from 2.9% to 4.1% by using AI to provide personalized shopping recommendations that aligned with its “effortless shopping” promise [3].


Tools for Tracking

To effectively monitor and improve conversion rates, CMOs should rely on tools that provide actionable insights:

Content and Brand Alignment

Content that aligns with your brand identity plays a critical role in driving conversions. These insights also tie into social media strategies, showing how engagement on different platforms leads to actions on your website.


7. Social Media Performance

Analyzing social media performance helps you understand how well your brand messaging connects with your audience before they even visit your website.

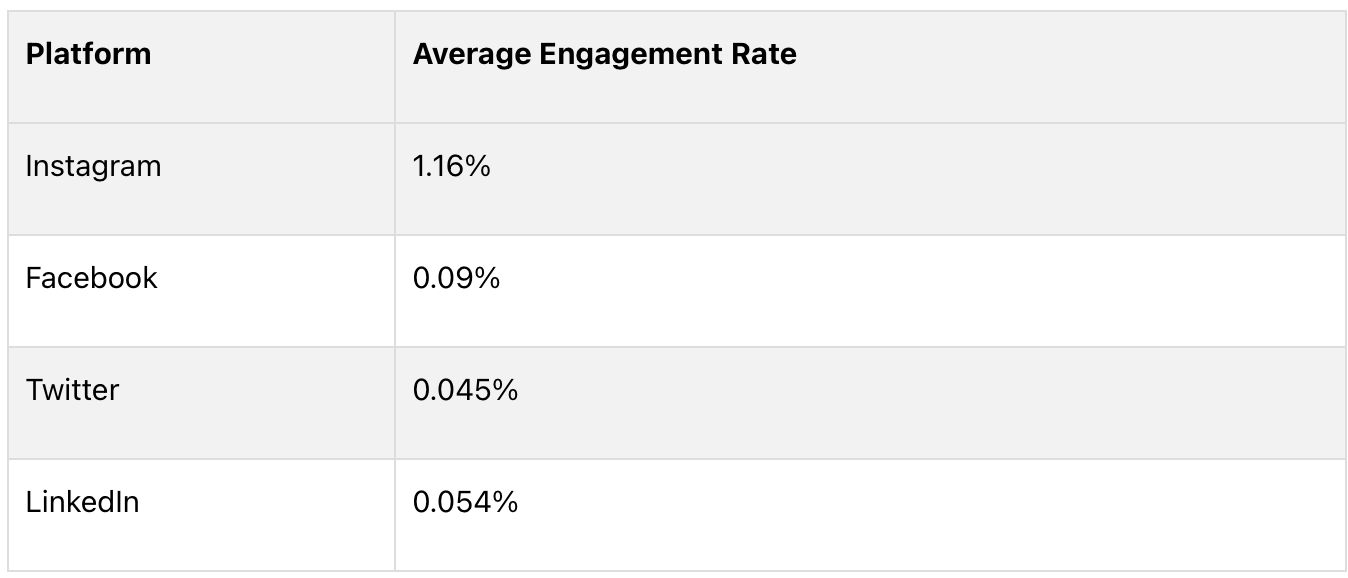
Social media metrics highlight how your audience engages with your content on various platforms. For instance, Instagram boasts an average engagement rate of 1.16%, making it a top choice for visual content strategies [1][3].


Platform-Specific Benchmarks (2024 Engagement Averages [2][4])

Key Metrics to Watch

  • Quality Interactions: Focus on meaningful actions like thoughtful comments, shares, and saved posts. These signal that your content is connecting with your audience.
  • Sentiment Analysis: Advanced tools now classify user sentiment (positive, neutral, or negative) with up to 89% accuracy [1]. This gives you a clearer understanding of how people perceive your brand.


Connecting Social Metrics to Conversions

Using UTM parameters in your campaign links allows you to track how social media engagement drives traffic and conversions on your website. This insight is essential for evaluating your return on investment (ROI).


Leveraging AI for Better Engagement

Tools like Semrush can identify trending topics in real time, helping you tweak your content strategy on the fly. For example, one retailer saw an 18% boost in engagement after adapting their content based on trending insights [1][5].


Practical Example: Sentiment Analysis in Action

A pizza chain noticed a 40% spike in negative mentions about the "soggy texture" of a new crust. After tweaking the recipe, positive sentiment rose by 22%, and Instagram story completion rates jumped by 15% within three weeks [1][5].

Tracking Content Performance

Short-lived content, like Instagram Stories, plays a big role in building brand awareness. Keeping tabs on these interactions helps you measure engagement and understand your brand's impact [1][3].


These insights are critical for calculating marketing ROI, especially when comparing the effectiveness of paid versus organic campaigns.


8. Marketing ROI Measurement

Understanding marketing ROI is essential for CMOs to justify spending and make informed decisions about channel investments. The basic formula is simple: [(Revenue Attributable to Marketing - Marketing Investment) / Marketing Investment] × 100. But today’s strategies demand a more detailed approach.


Three-Tiered Measurement Framework

A layered framework helps balance short-term results with long-term brand growth:

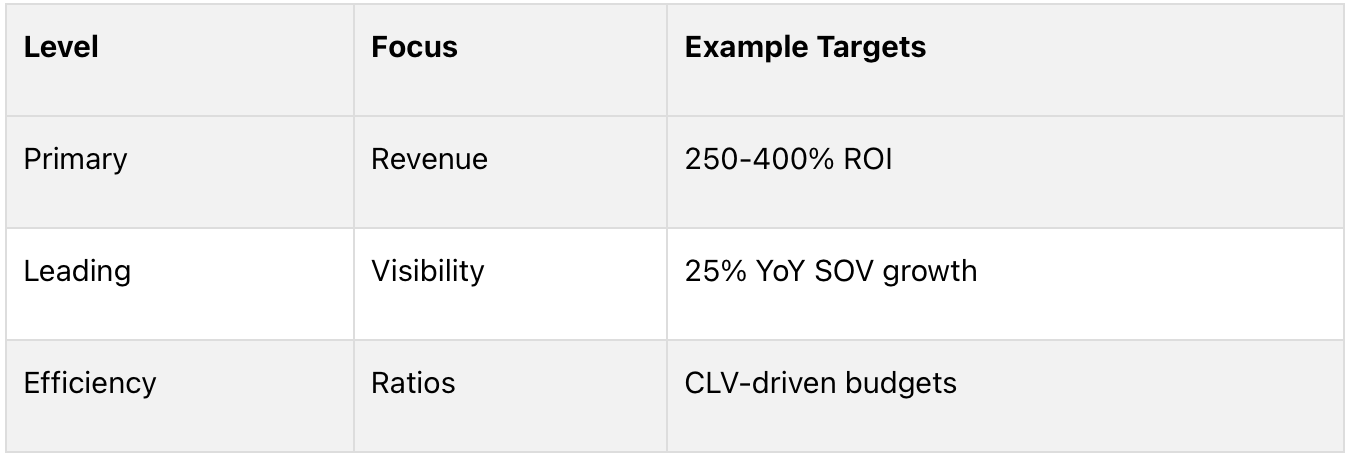
This structure connects campaign performance to overall brand equity.


Advanced Attribution Models

Multi-touch attribution is now a must-have for precise ROI tracking. For example, Adobe's marketing team merged CRM data with website analytics in 2022. This led to a 23% boost in ROI and allowed them to reallocate $5 million to more effective channels [1][2].


Industry-Specific ROI Benchmarks

Different industries see varying ROI benchmarks. Consumer goods typically achieve 250% ROI, with top performers exceeding 400%. Meanwhile, B2B SaaS averages around 180% [2].


AI-Powered ROI Prediction

AI is reshaping ROI analysis, offering prediction accuracy of up to 89% in leading marketing platforms [2]. Here's a real-world example:

"Our predictive modeling reduced CAC errors by 22% while forecasting creative impact on 30-day ROI" [2].

Brand Health's Influence on ROI

Brand health metrics are closely tied to financial performance [2]. This ties into CLV-focused strategies from Section 5, which emphasize retaining high-value customers. Additionally, the link between tracked NPS (Section 3) and repeat purchase ROI highlights the importance of integrated metrics. By analyzing ROI accurately, marketers can pinpoint which channels drive the most qualified leads.


9.  Lead Conversion Success

Marketing ROI measures campaign effectiveness, but lead conversion success focuses on how efficiently interest is turned into revenue.


Key Metrics for Conversion Success

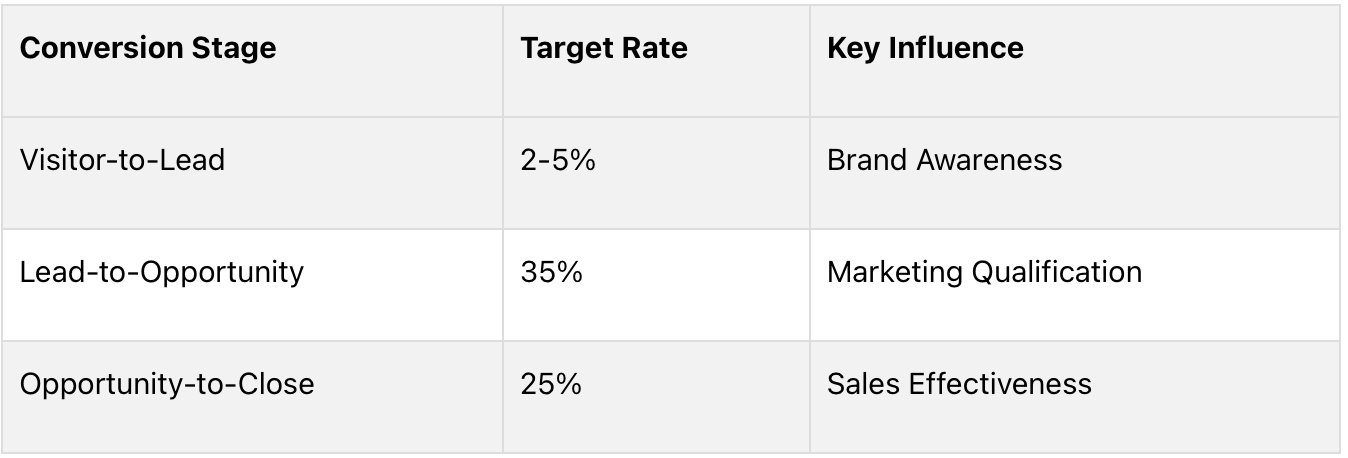
When enterprise B2B companies follow this framework, they can achieve an overall conversion efficiency of 8.75%, provided everything is executed correctly [2][4].


The Role of Advanced Lead Scoring

A strong lead scoring system evaluates three main factors: demographic fit (40%)engagement (30%), and intent signals (30%). Leads that score above 80 points are five times more likely to convert compared to ungraded leads [4].


Testing for Better Results

The format of your content matters. For example, video case studies have been shown to increase manufacturing lead conversions by 22% compared to text-only content [2]. This highlights how presentation can shape brand perception.


Calculating the True Cost of Conversion

Here’s the formula to determine cost-per-conversion:


(Total Marketing Spend + Sales Enablement Costs) ÷ Number of Converted Leads


For instance, if a company invests $500,000 and converts 200 leads, the cost per conversion comes out to $2,500 [2][4]. This metric is essential for evaluating how well brand messaging reduces sales barriers across different channels.


10. Brand Value Assessment

Lead conversion focuses on short-term results, but assessing brand value offers insights into its long-term impact. This process depends on three key factors:


Core Components

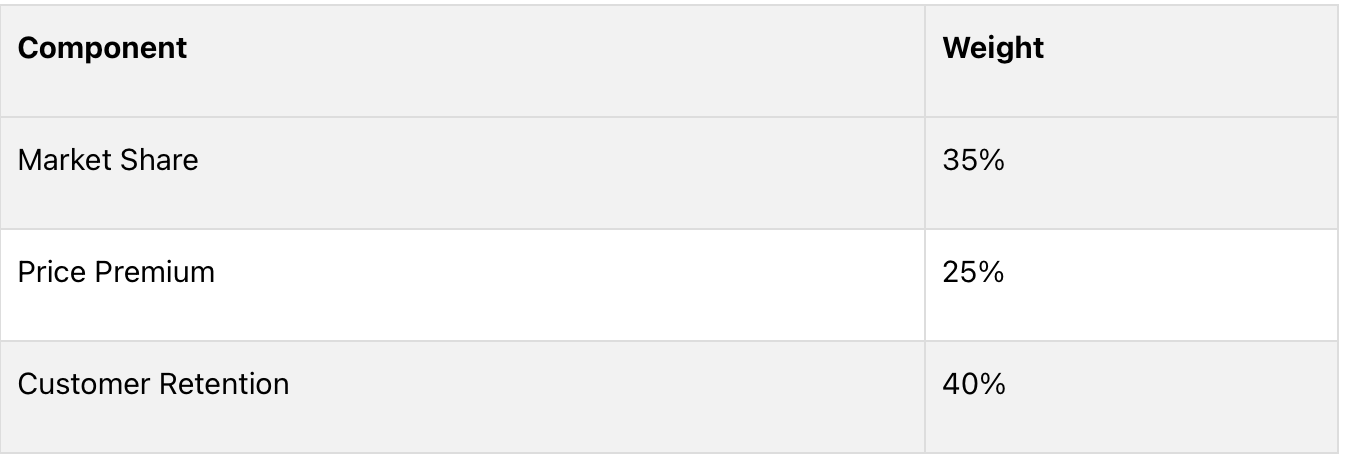
Customer Retention connects directly to the CLV metrics discussed in Section 5, offering a complete picture of brand performance.


Real-World Examples

Take Nike, for instance. Between 2023 and 2024, the company boosted its brand value by 45%. This growth stemmed from an 18% rise in search activity and a 22% acceptance rate for premium pricing [2][3]. Similarly, Adobe's integrated strategy (highlighted in Section 1) demonstrates how aligning efforts can enhance brand value.


Three-Phase Measurement Approach

To measure brand value effectively, organizations typically follow this structure:

  • Digital Indicators: Monitored quarterly
  • Financial Models: Evaluated annually
  • Third-Party Audits: Conducted every two years [2][9]


Connecting Brand Value to Growth

Strong brands often lead to better financial outcomes. An analysis of the S&P 500 shows that companies in the top valuation quartile achieve 3.2 times higher market-adjusted returns over five years [2][6]. The correlation (r=0.79) between brand value growth and shareholder returns highlights the importance of this metric for CMOs.


Current Trends in Valuation

Brands aligned with ESG principles are now seeing valuation multiples that are 19% higher than their peers [2][6]. This demonstrates how ethical positioning can directly influence brand equity.

"Accurate assessment requires blending financial metrics with consumer sentiment data [9]"

To truly capture a brand's worth, companies must combine traditional financial data with consumer perception metrics and digital performance insights. This approach ensures a more comprehensive understanding of total brand equity.


Tools and Methods Comparison

Tracking metrics effectively means using tools that align with your brand's specific goals - from building awareness (Section 1) to evaluating value (Section 10). The right choice depends on your organization's size and measurement needs.


Enterprise vs. SMB Solutions

Enterprise tools, like SEMrush Media Monitoring, offer advanced features and handle large-scale data analysis, making them ideal for bigger organizations. On the other hand, tools designed for SMBs focus on affordability and essential features.

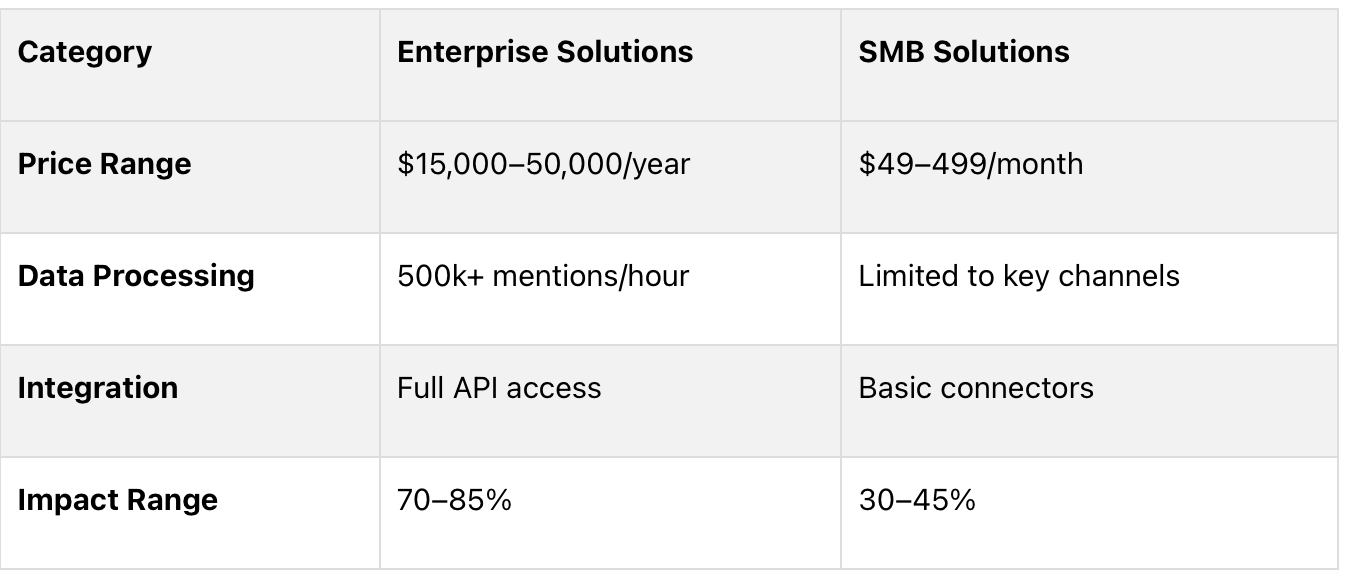
These tools play a key role in measuring metrics like Share of Voice (Section 2) and Marketing ROI (Section 8).


Combining Methods for Better Accuracy

Combining techniques can lead to better results. For example, pairing social listening with surveys improves accuracy by 42% [5]. Integrated dashboards also help keep metrics organized while avoiding overlap.


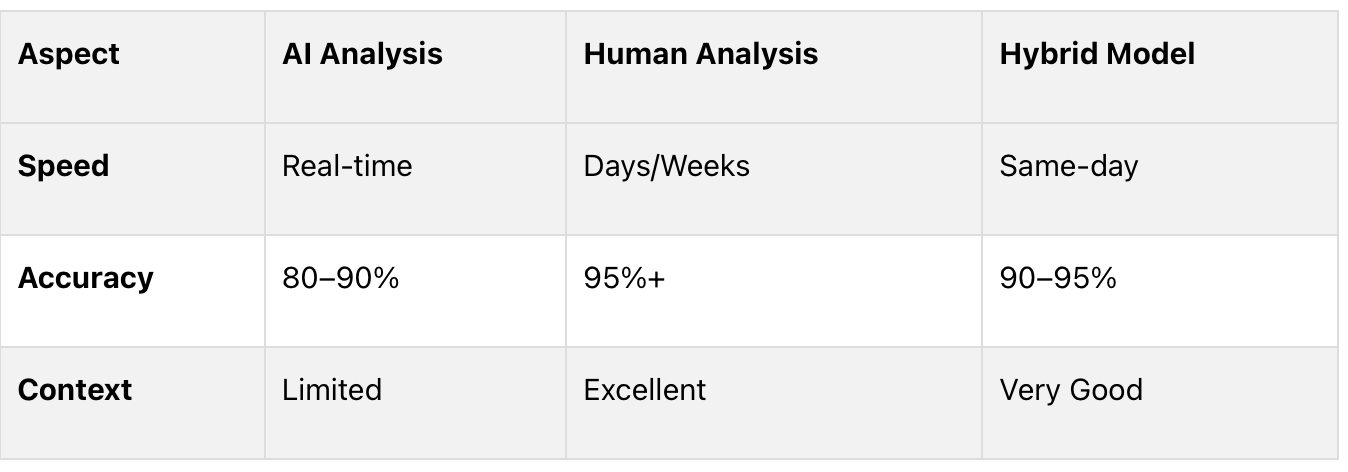
AI-Powered vs. Human Analysis

For tasks like NPS analysis (Section 3) and social listening (Section 7), a mix of AI and human input often works best. Here's how they compare:

Integration Capabilities

Top platforms like Sprout Social and Brandwatch excel at pulling data from multiple sources. Medallia stands out by linking NPS scores with customer sentiment from support interactions [6], giving CMOs a complete picture of brand health.


Balancing Costs and Benefits

Premium tools require a higher investment but often deliver clear, measurable results.


Focus on Real-Time Monitoring

Modern platforms increasingly highlight real-time tracking, allowing brands to stay ahead in fast-changing environments.


Key Takeaways

Building an effective brand strategy means focusing on the 10 core metrics and prioritizing them based on your business stage. According to Forrester, companies that track six or more metrics see 2.3x faster revenue growth than their competitors.


Strategic Implementation by Business Phase

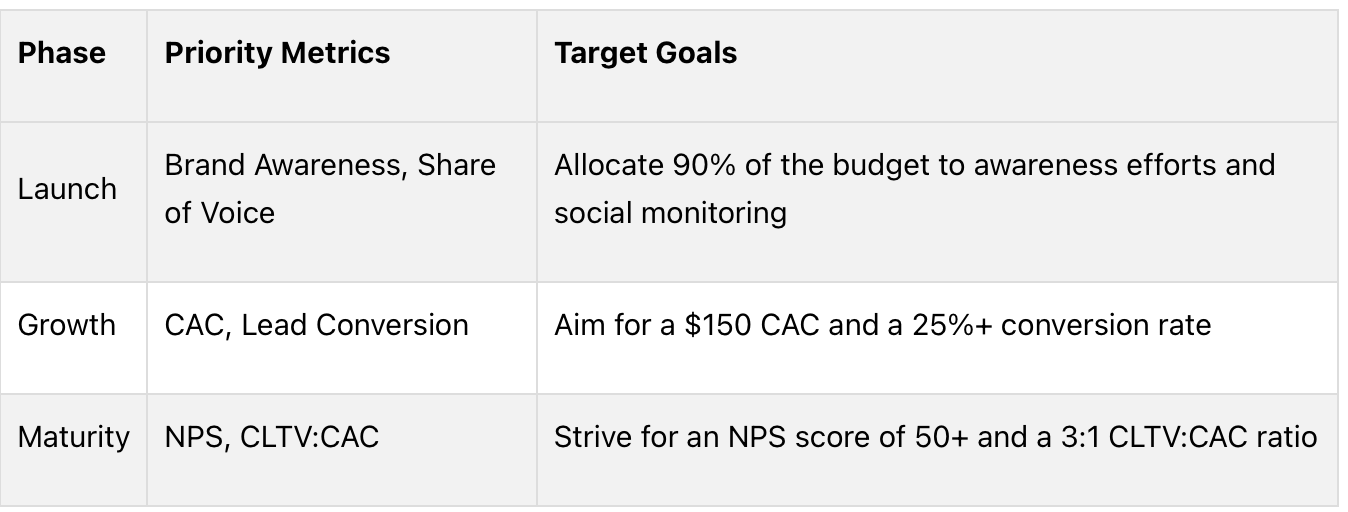
These priorities are rooted in the interconnected metrics framework discussed in earlier sections.


Data-Driven Success Factors

A balanced approach works best: 70% quantitative metrics (like CLTV and conversions) combined with 30% qualitative insights (such as social sentiment and surveys) [2][3].


Technology Integration Impact

AI-powered tools are changing how metrics are tracked. Current platforms can:

  • Predict NPS trends by analyzing sentiment patterns
  • Automate share-of-voice tracking in over 50 languages
  • Use machine learning to forecast CLTV [4][6]


Cross-Functional Communication

Translate metrics into business-focused outcomes. For example:

  • Brand awareness can be reframed as "Market Footprint Potential"
  • ROI can be presented as "Revenue Per Dollar Invested" [4][6]


Future-Proofing Your Metrics

Automation is shaping the future of brand measurement. Expect advancements in cross-channel sentiment analysis and real-time market share tracking. Nike's recent valuation growth, discussed in Section 10, highlights the importance of these tools [1][3].


Risk Mitigation

Focus on:

  • Engagement metrics instead of vanity metrics
  • Cross-metric analysis for a deeper understanding [1][3]


The secret to success is choosing metrics that match your business's growth stage while staying flexible enough to adapt to changing market conditions.

By Matt Bowen September 15, 2025
Your brand might not be as clear to your customers as you think. While internal teams focus on strategy and execution, customers only see the end result. This disconnect can lead to blind spots, inconsistent messaging, and missed opportunities. What’s the solution? An objective brand assessment. By bringing in an external perspective, you can identify gaps in how your brand is perceived, align your messaging with customer needs, and uncover areas for improvement. Here’s why it matters: Internal biases often mask issues like tone drift, outdated visuals, or unclear messaging. Competitor analysis reveals overused industry clichés and helps you stand out. Data-driven tools like customer surveys and message testing provide actionable insights. Consistent messaging across all platforms can boost revenue by up to 23%. An objective review doesn’t just clarify your brand’s position - it leads to measurable growth, better alignment within your team, and stronger customer connections. If your sales are slipping, your messaging feels outdated, or your brand is blending into the crowd, it’s time to reassess. Outside Perspective and Blind Spots When you're deeply involved in your brand's daily operations, it's easy to lose sight of how others perceive it. This "tunnel vision" can lead to blind spots where internal clarity doesn't match external impressions, potentially weakening your brand's impact. Finding Blind Spots with Fresh Eyes Blind spots often go unnoticed by internal teams but are glaringly obvious to your audience. This disconnect can damage credibility and reduce your brand's effectiveness [ 1 ]. Take "tone drift" or "visual drift", for example. Over time, subtle changes in messaging or design can creep in without anyone on the inside noticing. Yet, customers quickly pick up on these inconsistencies. Maybe your brand voice shifts slightly with each new campaign or hire, causing it to stray from its original identity and leaving customers confused. External reviewers frequently identify issues like inconsistent social media tones, a mismatch between brand values and customer support actions, or outdated visuals and messaging [ 1 ]. Even before customers directly interact with your brand, their perception starts forming based on factors like your website layout, bio text, pinned posts, or response times [ 1 ]. Another challenge is the "internal silence" that can form within teams. When dissenting opinions aren't encouraged, it's harder to question assumptions or spot new opportunities [ 3 ]. This is where outside reviewers or external experts can make a big difference. They bring an unbiased perspective, unclouded by daily involvement, to challenge assumptions and identify blind spots [ 1 ][ 3 ]. A simple yet powerful tool to test your brand's clarity is the "Stranger Test." Show your website or social media to someone unfamiliar with your brand for just a few seconds, then ask them what they think you do. If their answer misses the mark, it could signal that your messaging isn't clear [ 2 ]. But blind spots aren't just about processes. Leadership bias can also distort how a brand evolves, making it crucial to balance strategic vision with customer data. Balancing Leadership Opinions with Customer Data Leadership often comes with strong emotional ties to certain messages, visuals, or strategies. While this passion can spark creativity, it can also make it harder to adapt to what customers truly need. Just as fresh eyes can uncover misalignments in branding, they can also help recalibrate leadership's deeply held beliefs. External feedback provides the distance needed to spot these hidden biases and align strategies with customer expectations [ 1 ]. The key is finding a balance between leadership's insights and customer data. Leadership offers valuable context and strategic vision, but pairing these with external feedback creates a more grounded approach. External agencies, for instance, can provide tools like sentiment analysis, social listening, and competitor tracking - areas that internal teams might overlook [ 1 ]. These insights reveal what resonates with your audience, what doesn't, and where untapped opportunities might lie. The most effective brand evaluations blend leadership's vision with customer realities. Being too close to your brand can make it hard to see missteps or confusion, which is why an outside perspective is essential for gaining clarity and improving alignment [ 2 ]. Competitor Analysis and Differentiation Understanding your competitive landscape isn't just about knowing who your competitors are. It's about recognizing where predictable, overused messaging dominates and carving out a distinct voice for your brand. Without differentiation, brands risk blending into the noise, becoming just another face in the crowd. Spotting Industry Clichés and Generic Messaging Every industry has its share of buzzwords that get thrown around so often they lose their impact. Phrases like "best in class," "world-class," "AI-powered," or "industry-leading" are prime examples. These terms have been used so frequently that they no longer set brands apart, making it easy for competitors to overshadow them [ 5 ]. When messaging relies on these overplayed terms, it becomes generic and uninspiring. This can alienate customers, weaken trust, and hurt your brand's credibility, ultimately impacting conversion rates [ 4 ]. Conducting a thorough competitor analysis helps identify these overused phrases and patterns. Once you see what’s being repeated across the industry, you can focus on refreshing your messaging. By stepping away from clichés, you open the door to uncovering overlooked opportunities that can set your brand apart. Finding Market Gaps and Opportunities Competitor analysis is more than just spotting tired messaging - it’s about identifying what’s missing. The real gold lies in uncovering gaps in the market: the unmet needs and untapped opportunities that your competitors haven’t addressed. These gaps are where your brand can step in and claim authority. By analyzing competitor messaging, you gain the insights needed to create messaging that stands out. This process not only highlights competitors' strengths and weaknesses but also reveals underserved customer segments [ 6 ]. These insights can guide you toward niche opportunities and unmet needs, fueling innovation and growth [ 6 ][ 7 ]. The advantage becomes even more pronounced when you refine your value proposition and craft a Unique Selling Proposition (USP). A strong USP showcases what makes your products or services distinct and better, giving customers a clear reason to choose you [ 6 ][ 8 ]. Additionally, competitive intelligence can sharpen your top-of-funnel content, making it more engaging and effective at grabbing attention [ 9 ]. Data-Driven Assessment and Measurable Results When it comes to evaluating a brand, data outshines opinions every time. Yet, many brands still rely on gut instincts or internal biases instead of hard evidence. A structured, data-driven approach transforms brand assessment into a strategic advantage, connecting internal strategies with the realities of the market. The Importance of Fact-Based Assessments The most effective brand evaluations draw from multiple data sources to provide a clear and complete picture of a brand's standing. For example: Customer surveys reveal how your audience genuinely perceives your brand. These insights often highlight gaps between how you think your brand is viewed and how it’s actually received. This helps you see if your messaging hits the mark - or misses entirely. Message testing allows you to gauge audience reactions before launching a full campaign. Instead of guessing whether a new tagline will resonate, you’ll have concrete data showing how it performs across various customer segments. Competitive audits bring an external perspective that internal teams might overlook. By analyzing competitors’ positioning, messaging, and market presence, you can uncover opportunities and threats that might not be obvious from the inside. This kind of intelligence helps you understand not just what competitors are doing, but how well they’re doing it. Together, these tools create a comprehensive framework that shifts branding from guesswork to a science. Measurable Benefits of Objective Assessments Using data-driven insights doesn’t just clarify your brand’s position - it delivers measurable results. When your messaging aligns with what customers truly care about, they respond more positively. For instance, unaided awareness studies often show improved brand recall and stronger top-of-mind positioning. Brands that undergo objective assessments frequently see faster and more accurate recognition when customers are making purchase decisions. Higher conversion rates are another clear benefit. When your brand communicates its value effectively and stands out from competitors, more prospects turn into paying customers. This improvement can be seen across various touchpoints, from website performance to sales team success. Stronger positioning also supports premium pricing, increases customer lifetime value, and lowers acquisition costs. Plus, it tends to attract more qualified prospects who are ready to make a purchase. These measurable results create a feedback loop, allowing brands to make regular, data-informed adjustments. Over time, this approach empowers brand leaders to refine their strategies and drive consistent growth. How Brand Assessments Drive Growth Objective brand assessments can transform business performance by turning external insights into measurable growth. They bridge the gap between understanding your brand and implementing strategies that drive results. Before and After: The Impact of Brand Assessments The difference between a scattered brand and a unified one is hard to ignore. Many brands operate with fragmented messaging - one channel might highlight innovation, another focuses on reliability, while a third emphasizes community. This lack of cohesion confuses customers and dilutes the brand's overall impact. But after a thorough brand assessment, everything changes. Messaging becomes consistent across all platforms. Whether it’s a website, a sales pitch, or a social media post, every interaction reinforces the same core values. This consistency pays off: brands with aligned messaging see a 23% increase in revenue compared to those with fragmented communication [ 10 ]. The transformation doesn’t stop there. Internally, teams that once operated in silos begin working together with a shared understanding of the brand’s identity. Marketing campaigns become sharper, sales pitches more compelling, and customer service interactions more aligned with the brand promise. It’s not just about looking unified - it’s about performing better. Stopping Scattered Marketing Efforts Unified messaging also helps streamline marketing efforts and optimize resources. Without clear guidelines, marketing teams often chase trends or experiment with inconsistent messages, leading to campaigns that fail to build momentum. Brand assessments solve this by introducing clear frameworks for tone, visuals, and content templates [ 11 ]. These guidelines don’t stifle creativity; instead, they provide structure. Local teams can adapt to their markets while staying true to the brand’s core identity. Centralized content distribution ensures every communication reflects the same values [ 11 ]. Marketing teams save time by reusing consistent assets, and sales teams benefit from materials that align with the brand’s messaging. This unified approach doesn’t just create a seamless customer experience - it also improves efficiency. When every marketing dollar supports the same goal, resources are used more effectively, and the cumulative impact grows. The benefits extend to team morale and productivity. Instead of debating what the brand should say or how it should look, teams can focus on execution. The assessment acts as a roadmap, allowing everyone to work toward a common goal and move the brand forward with confidence. Practical Guide for Brand Leaders Knowing when and how to conduct a thorough brand assessment can make all the difference in staying competitive in today’s fast-paced market. Here’s a practical guide to identifying the right moments to act and taking the necessary steps to ensure your brand remains relevant. Spotting the signs early can help you address potential issues before they grow into larger challenges. Signs It's Time for an Objective Brand Assessment There are several telltale signs that your brand might need a closer look. Major changes within your business - such as launching new products, navigating market shifts, mergers, or securing funding - often mean your brand’s current positioning might no longer align with your goals [ 12 ][ 13 ]. A dip in performance is another clear signal. If you’re noticing declining sales, underwhelming campaign results, or poor KPIs, it could point to deeper issues with your brand messaging [ 12 ][ 13 ]. Customer confusion or outdated brand elements also serve as strong indicators. If customers struggle to understand what your brand stands for, or if your branding feels stuck in the past, it’s time to reassess [ 12 ]. Internal misalignment is another red flag. When leadership teams clash over brand goals or employees can’t articulate the brand’s value clearly, it often translates to a muddled external image [ 12 ][ 13 ]. Lastly, if your brand starts blending into the crowd or losing ground to competitors, it’s a sign your positioning isn’t working. An objective review can help uncover ways to stand out and reclaim market share [ 13 ]. When these warning signs appear, acting quickly is key to staying ahead. How Often Should Brands Conduct an Assessment? The timing of brand assessments varies depending on your industry and business needs, but there’s growing evidence that regular reviews are becoming more critical. For example, 90% of companies say their industries have grown more competitive in the past three years, with nearly half describing the shift as significant [ 17 ]. Add to that the fact that around 30,000 new products hit the market annually, and it’s clear why staying relevant requires constant attention [ 17 ]. For most brands, an annual assessment is a good starting point to keep tabs on competitive trends and shifting customer preferences [ 14 ]. However, industries that move quickly may need to assess key brand elements every quarter [ 14 ]. Beyond routine check-ins, certain events call for immediate action. Expanding into new markets, leadership changes, economic disruptions, or bold moves by competitors are all triggers for a brand review. If your company’s progress feels slower than expected or external forces are reshaping your industry, waiting for the next scheduled assessment could mean missing critical opportunities [ 15 ][ 16 ]. Choosing the Right Partner for the Job Once you’ve decided to reassess your brand, the next step is finding the right external partner to guide the process. The ideal partner should bring strong research skills and strategic expertise - not just design capabilities. Look for someone who can perform in-depth customer surveys, competitive analyses, and message testing that explore both the emotional and logical drivers behind customer decisions. A great partner will know how to turn these insights into actionable strategies that differentiate your brand and boost revenue. They should also clearly show how their recommendations connect to measurable business outcomes. While familiarity with your industry can be helpful, it’s more important that the partner excels in delivering solid research and strategic advice. Collaboration is equally important. The best partners work closely with your internal teams to ensure their findings lead to meaningful changes across marketing, sales, and product development. When evaluating potential partners, ask for case studies that demonstrate how their work has led to tangible improvements, like a stronger market position, revenue growth, or successful expansion into new markets. The Last Word: Using Objectivity to Move Your Brand Forward Taking an objective look at your brand isn’t just a good idea - it’s a game-changer. Bringing in an external perspective can uncover blind spots that internal teams might overlook. It also helps break free from the rut of “this is how we’ve always done it,” opening the door to fresh opportunities. By combining external insights with a competitive review, you can pinpoint where your messaging might be falling flat and where untapped opportunities lie. When industry messaging starts to blur together, customers often shift their focus to price instead of forming a real connection with your brand. A competitive analysis can help you find the gaps where your brand can truly stand out. Relying on data-driven insights takes the guesswork out of decision-making. Instead of relying on gut instincts or internal politics, tools like customer surveys, message testing, and perception audits provide solid evidence of what works. This kind of clarity empowers your team to make confident, strategic moves. But perhaps the biggest benefit of an objective assessment is the alignment it fosters within your organization. It helps eliminate disjointed marketing efforts that waste time and confuse your audience. Instead, it creates a clear, fact-supported narrative that everyone on your team can rally around. When leadership and marketing are aligned, the brand strategy becomes more focused and impactful. Ultimately, adopting an objective view of your brand sets the stage for growth. The question is: will you take action on these insights before your competitors do?
By Chris Langathianos August 12, 2025
For many companies, the fourth quarter is both a sprint and a launchpad. You’re closing out revenue goals, but you’re also laying the groundwork for the year ahead. The brands that finish strong and start fast aren’t lucky — they’re intentional. They know their customers, they have a clear positioning strategy, and they operationalize that strategy across every part of the business. There are currently a lot of economic factors that need to be considered – from consumer uncertainty to tariffs. If you want your brand to stand out in 2026, here’s your Q4 readiness checklist, built on the principles we use at Brandigo: deep customer insight, data-conscious positioning, and smart use of tools — including AI — to make your marketing more effective and scalable. 1. Revisit Your Customer Research Why it matters: Markets shift quickly. According to Salesforce’s State of the Connected Customer report, 71% of consumers expect companies to deliver personalized interactions, and 76% get frustrated when this doesn’t happen. Action : Review customer and prospect data from the last 12 months. Conduct a quick pulse survey or a set of short customer interviews to understand evolving needs, priorities, and challenges. Look for gaps between what you think your customers want and what they’re actually telling you. 2. Audit Your Brand Positioning Why it matters: Even the most powerful creative loses steam if it’s not anchored in a clear, differentiated brand position. McKinsey research shows companies with strong, consistent brand positioning achieve up to 20% higher profitability than competitors. Action: Review your current positioning statement and messaging pillars. Ask: Are we still saying something truly unique? Is it backed by proof points customers care about? Test your positioning with a sample of your target audience before rolling into new campaigns. 3. Align the Organization Around the Brand Why it matters: A brand strategy that only lives in the marketing department won’t move the needle. Operationalizing your brand means integrating it into sales conversations, customer service interactions, hiring practices, and product development. Action : Host a Q4 “brand alignment” session with leaders from every department. Provide a simple one-page “brand playbook” that outlines tone of voice, value propositions, and core messaging. Encourage each department to share how they’ll bring the brand to life in their own work. 4. Review and Refresh Content for Q4 Campaigns Why it matters: The end of the year is noisy. To stand out, you need content that’s relevant, timely, and connected to your brand story. HubSpot reports that companies publishing 16+ blog posts per month generate about 3.5 times more traffic than those publishing 0–4. Action: Map your content to both year-end offers and early-year positioning. Refresh high-performing evergreen content with updated data, visuals, or CTAs. Plan for post-holiday engagement — not just pre-holiday promotions. 5. Embrace AI to Accelerate Marketing Workflows Why it matters: AI isn’t replacing brand strategy — it’s amplifying it. According to PwC, 86% of CEOs say AI is a “mainstay” in their offices, with the biggest gains coming from productivity and personalization. Action : Identify 1–2 AI tools that can help you speed up specific workflows, like content drafting, image creation, or data analysis. Set clear rules for how AI will support — not replace — your team’s strategic and creative decision-making. Train your team to use AI ethically, ensuring your brand’s authenticity is never compromised. 6. Set Measurable Goals for the New Year Why it matters: The best time to plan Q1 is before Q4 ends. Brands that start January with clarity waste less time “warming up” and more time gaining market share. Action : Define key brand metrics for Q1: awareness, consideration, engagement, and conversion. Align these with broader business goals, ensuring they’re measurable and trackable from day one. Set up dashboards or reporting tools so progress is transparent across the organization. In Short… Your Q4 is more than just the final quarter of the year — it’s your brand’s launchpad into the next. By combining deep customer insight, differentiated positioning, internal alignment, and the smart use of tools (including AI), you can finish strong, start stronger, and keep your brand ahead of the curve.